Jacksonville June Market Summary
July 18, 2023 | Amanda Searle
The real estate market is constantly changing and understanding the correlation between different metrics can greatly benefit both buyers and sellers. Let’s dive into the data to see how these metrics are interconnected and how they can influence your decisions in the real estate market.
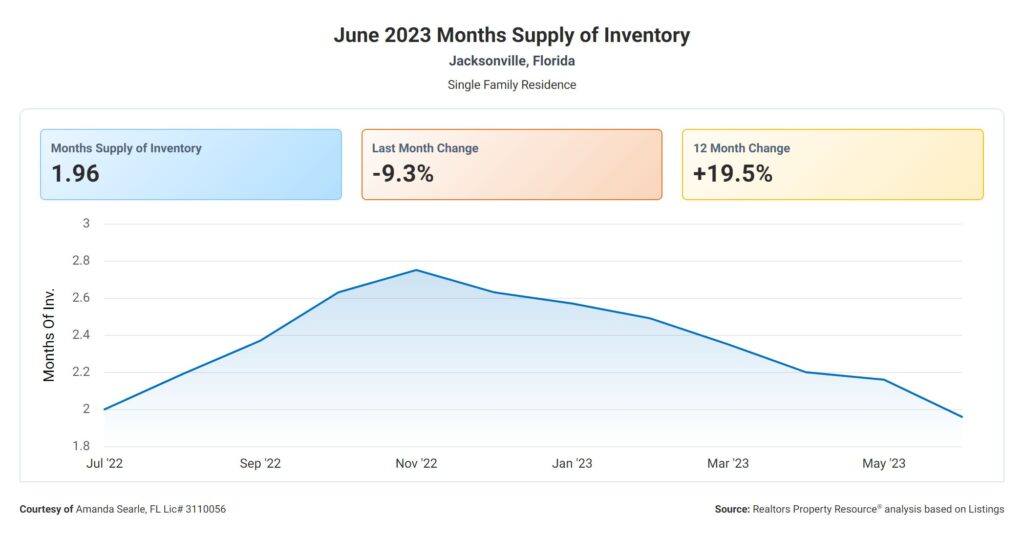
First, let’s take a look at the Months Supply of Inventory, which stands at 1.96. This metric represents the number of months it would take to sell all the currently listed properties on the market, assuming no new listings are added. A lower supply of inventory generally indicates a seller’s market, where there are more buyers than available homes. This can lead to increased competition and potentially higher prices.
Now, let’s consider the 12-Month Change in Months of Inventory, which shows an increase of 19.51%. This indicates that the supply of inventory has increased over the past year. While this change may suggest a shift towards a buyer’s market, it’s important to note that the supply is still relatively low at 1.96 months. Sellers should be aware of this increase and adjust their pricing and marketing strategies accordingly.
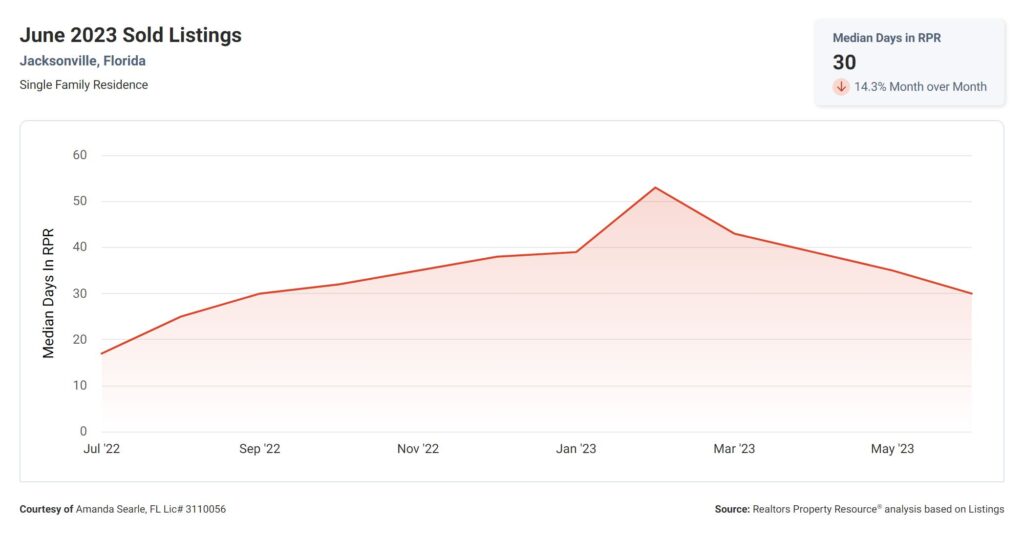
Moving on to the Median Days Homes are On the Market, we see that it is currently at 30 days. This metric represents the average number of days it takes for a home to sell once it is listed. A lower number of days on the market generally indicates a faster-paced market, where properties are selling quickly. Buyers should be prepared to act swiftly when they find a home they are interested in, as it may not stay on the market for long.
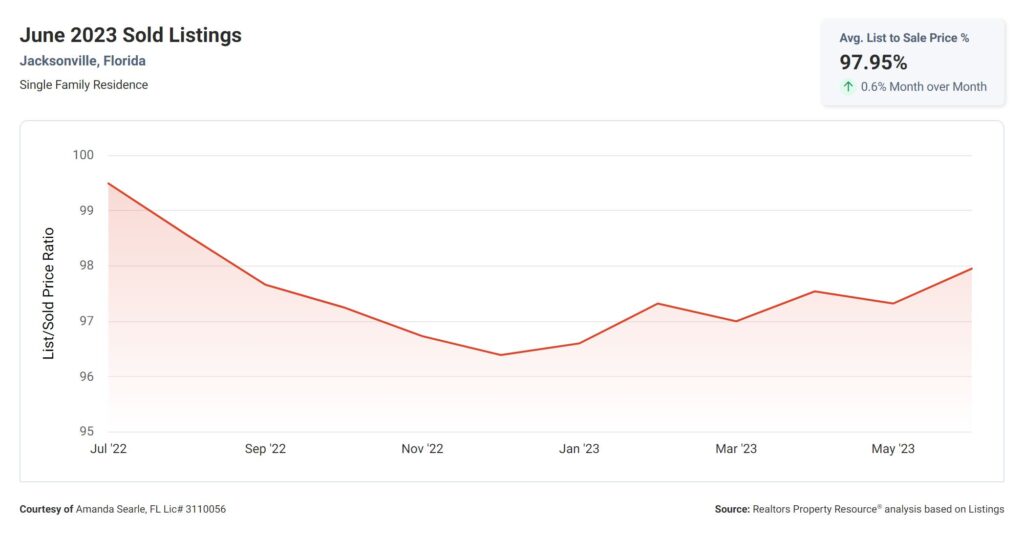
Next, let’s explore the List to Sold Price Percentage, which stands at 98%. This metric represents the percentage of the original listing price that sellers typically receive when their property is sold. A higher percentage suggests that sellers are receiving offers close to their asking price. This can be an indicator of a strong seller’s market, where buyers are willing to pay a premium for desirable properties.
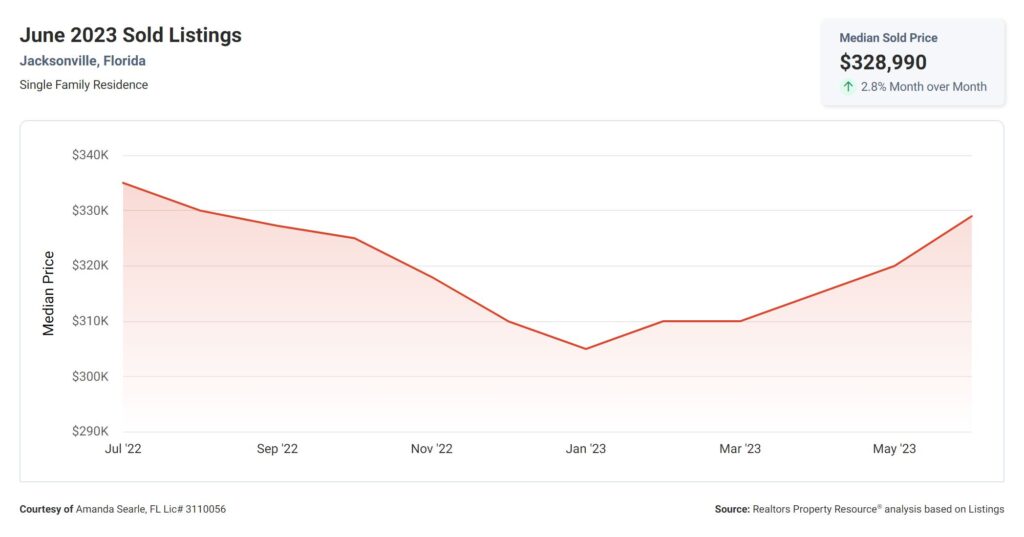
Lastly, we have the Median Sold Price, which currently stands at $328,990. This metric represents the middle point of all the home prices sold in a given period. It is important for both buyers and sellers to be aware of the median sold price as it provides insights into the pricing trends in the market. Sellers can use this information to determine a competitive listing price, while buyers can use it to evaluate whether a property is within their budget.
In summary, the real estate metrics provided showcase a market with a relatively low supply of inventory, which indicates a seller’s market. However, the increase in the 12-Month Change in Months of Inventory suggests a slight shift towards a buyer’s market. Homes are selling relatively quickly, with a median of 30 days on the market, and sellers are receiving offers close to their asking price. The median sold price of $328,990 provides a benchmark for both buyers and sellers to gauge the value of properties in the market. It’s important to stay informed about these metrics as they can guide your decision-making process in the dynamic real estate market.